.png)
3 min read
How we solved Rails Memory issue with Jemalloc
At iFarmer, we found that our rails application puma server processes are eating too much memory over time and we had to restart every time to solve the issue.How ever we were trying to find a solution for the problem and we got jemalloc.
Our Server is stable after installing jemallock.
Our Puma application server frequently ran out of memory. This was a major risk to our business because these web servers process almost all of our APIs. We also have background job servers, which we use as background job processors, and scheduler servers, which also run background jobs. When we noticed memory problems, the biggest impact was on the application servers. Our most heavily used backburners were also restarting, but less frequently than our Puma servers.
Fire fighting Still left Things Unstable
We made a quick fix by using a shecduler job to restart the Puma service whenever memory exceeded a certain threshold. This unsatisfactory short-term solution had many operational and performance implications:
We found that to prevent our Puma servers from running out of memory, we were preemptively restarting them multiple times a day. This was much more frequent than when we first implemented the scheduler job. It was urgent to find a solution that wouldn’t require services to be restarted.
Reason Behind Memory Growing
Instead of chasing unknown culprits, we went straight to the common source of many of our challenges: known issues with Ruby. We began with jemalloc, thinking, “If this solves the problem, we won’t need to investigate for leaks and local caching.”
Meet jemalloc
While trying to understand a bit more why this was happening we bumped into this article from the creator of Sidekiq: Taming Rails memory bloat. The author explains how switching from the standard glibc memory allocator to jemalloc improved the memory usage of their sidekiq worker processes dramatically.
We decided to give it a go in the hope that we would see similar improvements.
Impletementations
Command to find out current memory allocator
ruby -r rbconfig -e "puts RbConfig::CONFIG['MAINLIBS']"
Output depending on the os(Mine is Mac)
-lpthread -ldl -lobjc
Command to install in Ubuntu
sudo apt update
sudo apt install libjemalloc-dev
Finally re installing the ruby with jemalloc
rvm reinstall 2.7.5 -C --with-jemalloc
Check the installation
ruby -r rbconfig -e "puts RbConfig::CONFIG['MAINLIBS']"
Output
-lz -lpthread -lrt -lrt -ljemalloc -lgmp -ldl -lcrypt -lm
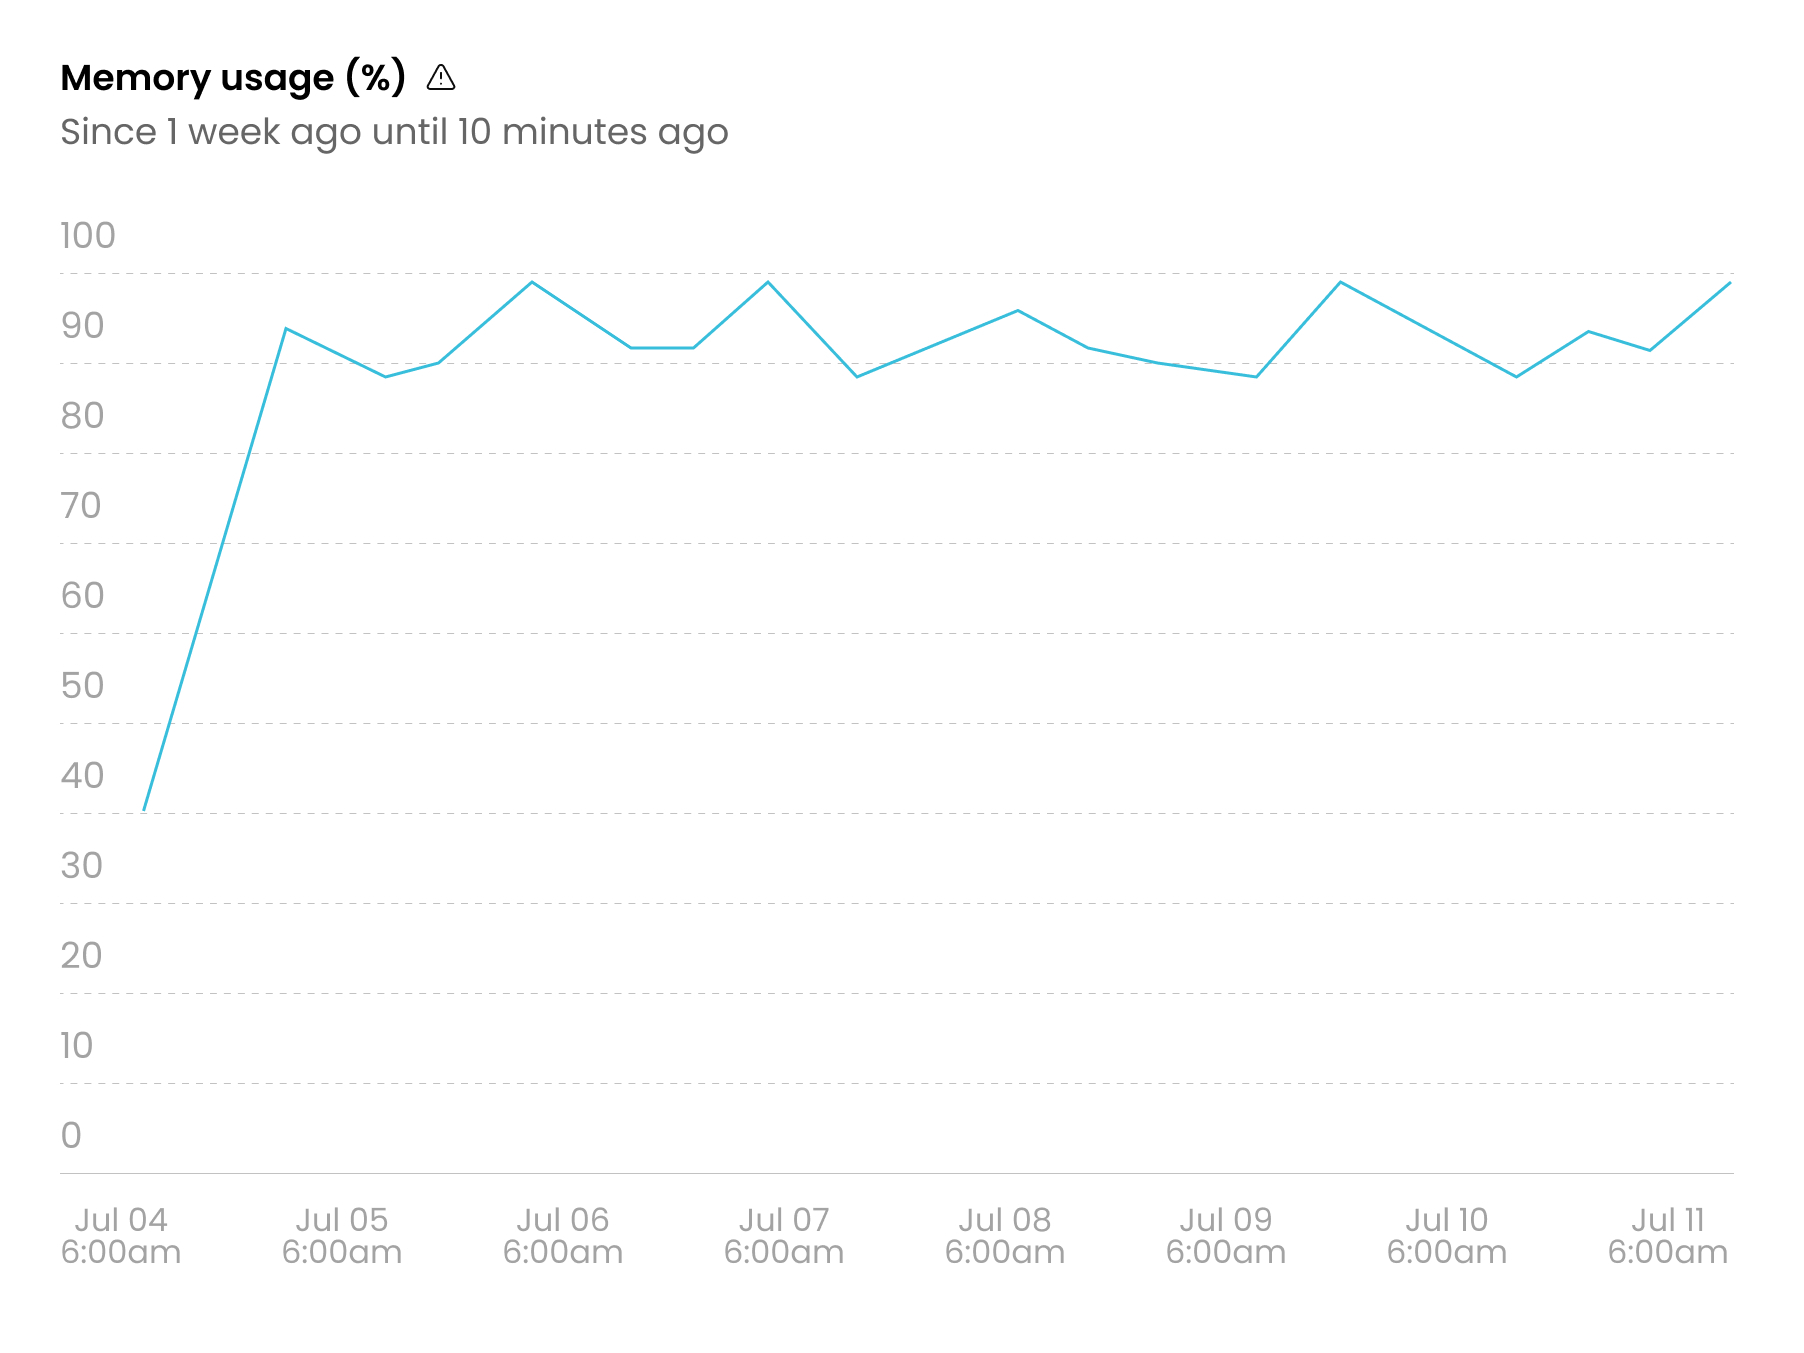
Results
Before Jemalloc
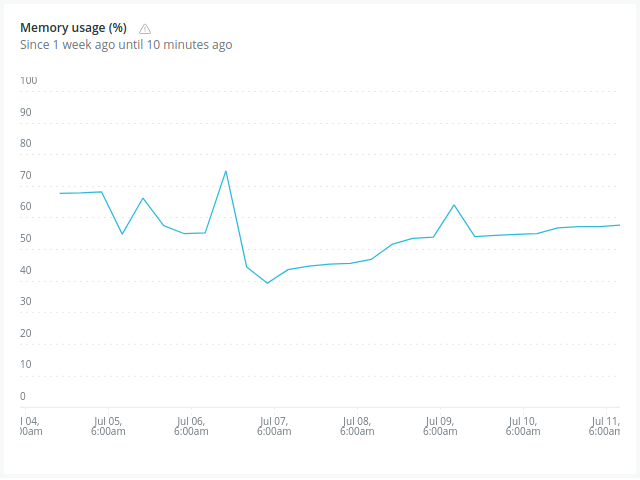
And after Jemalloc.
happy coding
